Interpreting Benchmarks: Throughput or Latency?
Benchmarks are fun but making sure you pick the right one and interpret the results correctly can be tricky
Benchmark results are always fun. Beyond making sure you even picked a representative benchmark (you did right?) are you sure you’re even interpreting the results correctly for your own use case?
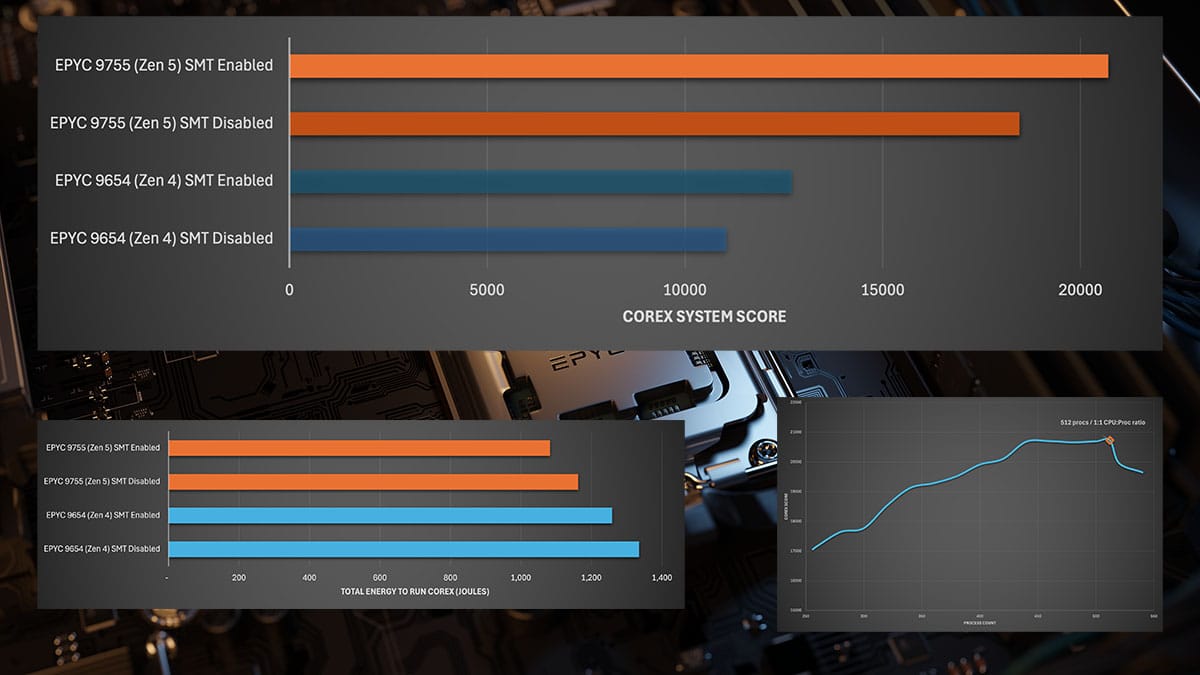
Let me give you an example, and just to make this isn’t taken as me throwing shade at someone else’s benchmark, I’ll even use one of our own. COREx. It was developed specifically to mimic financial risk systems. So, if you’re looking to calculate how much money you stand to lose if the AI bubble pops, that’s the benchmark to use right?
Maybe.
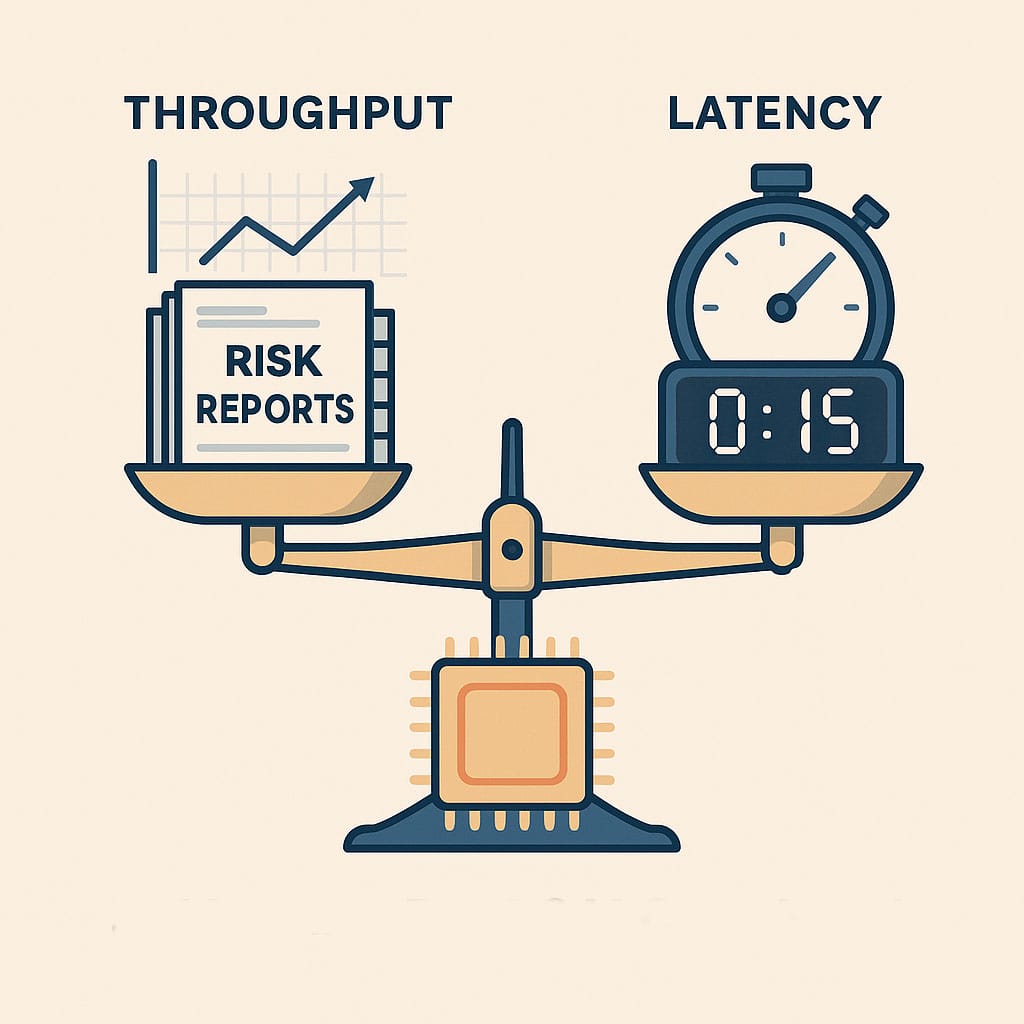
Most risk systems I’ve ever come across operate in at least two different modes. Running end of day risk that runs overnight and interactive (often inaccurately called real time) risk. Which of those two use cases are you optimising for?
If you look at the headline scores for COREx you’d be optimising for throughput. You need to calculate a very large amount of financial risk for the lowest possible cost (and within a certain timeframe). That’s great for end of day risk.
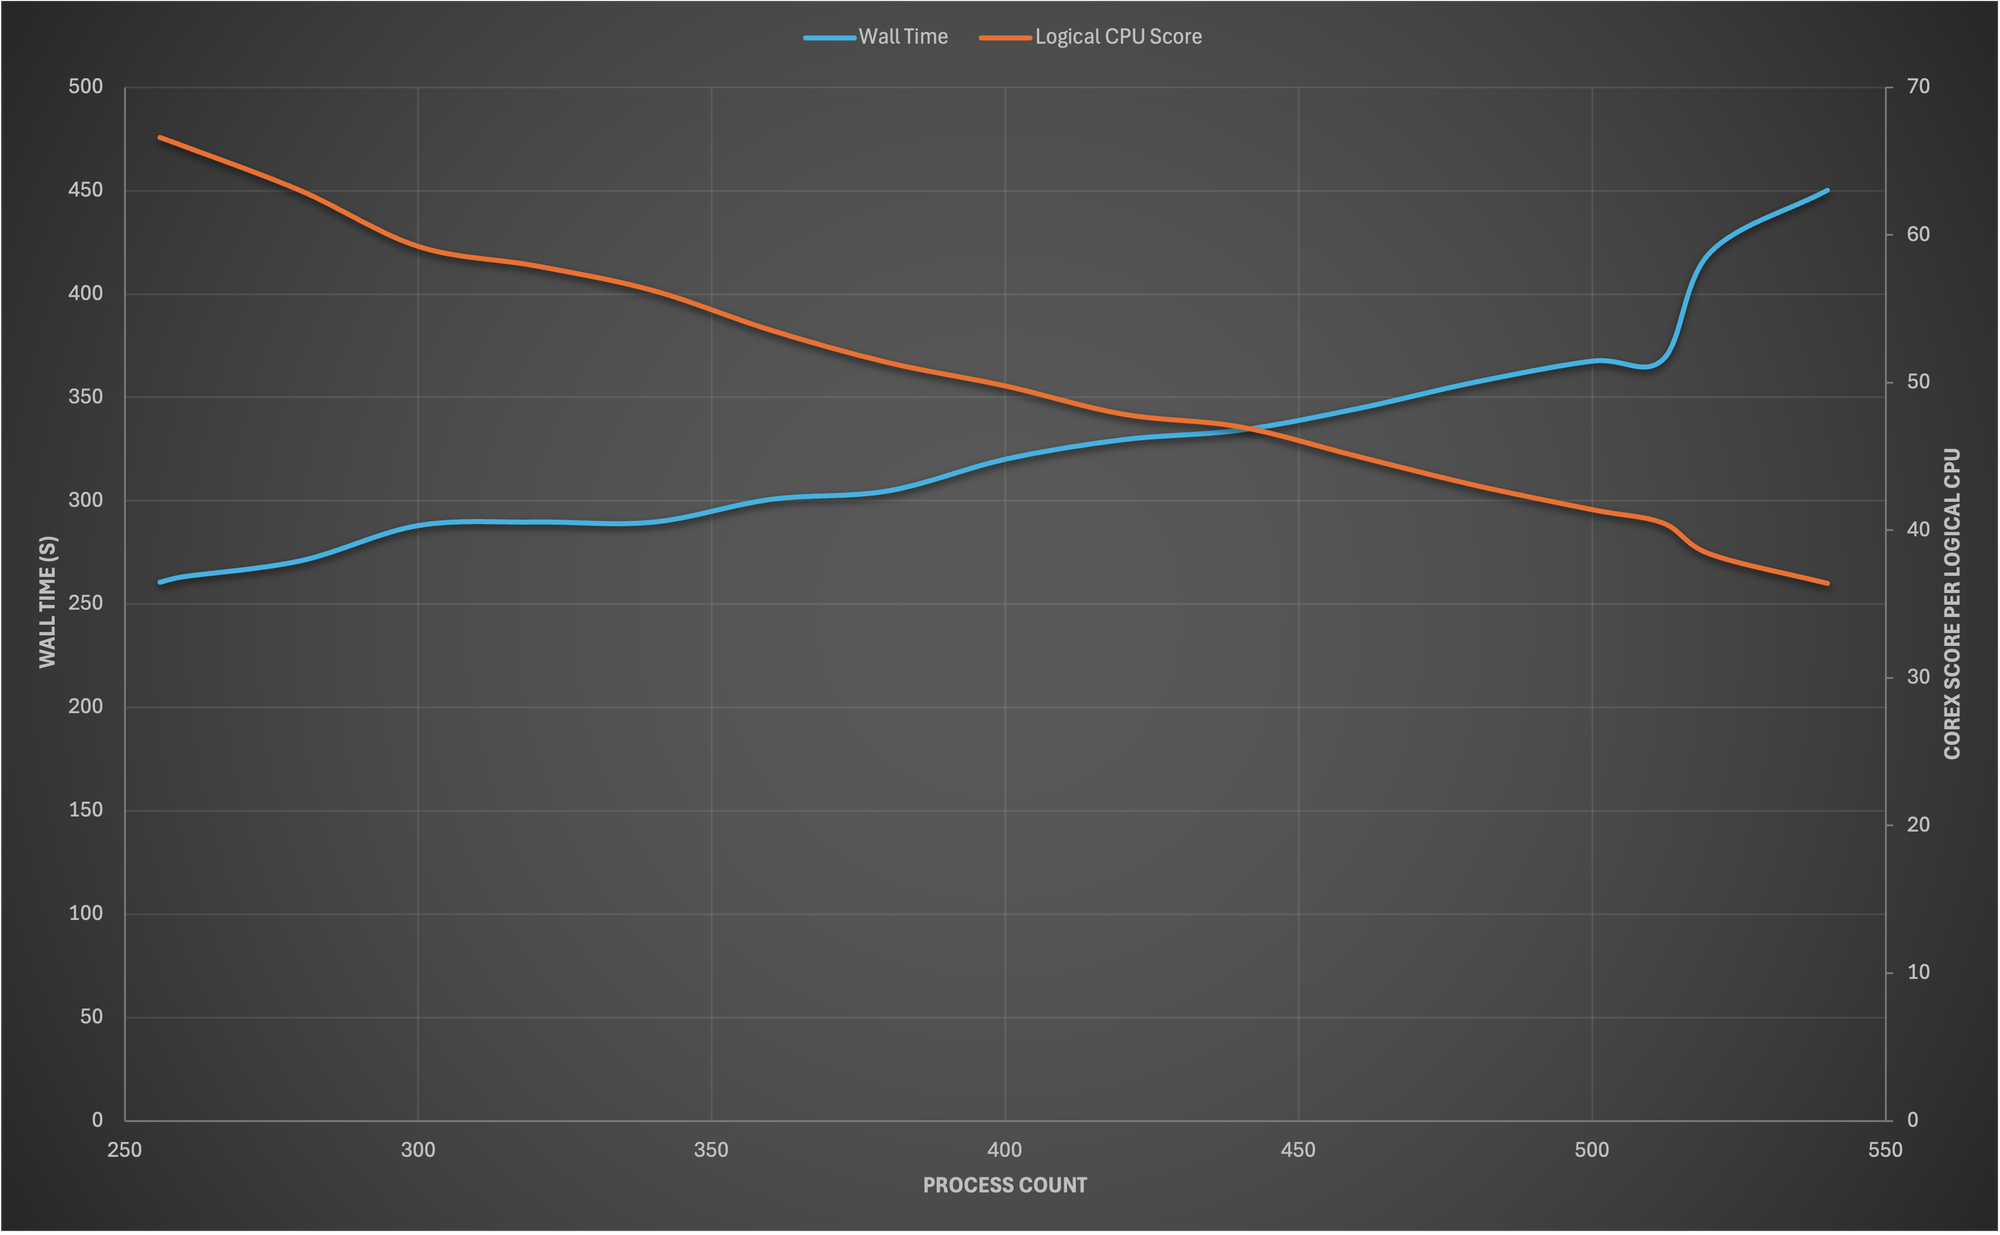
If you were looking to optimise for interactive risk though you’re looking at the wrong metric. What matters here is the time to result. Even if this means using more compute (expense). In this case the headline COREx score won’t help, instead it’s the wall time that’s of interest. (Yea we’ll add another score to the results in COREx v2 to make this more obvious).
The difference here isn’t small either, on the same hardware we observed improvements of up to 30% in latency when correctly optimising for it instead of the headline COREx score.
More details in our paper “Optimising Financial Services HPC Workloads”