The Hidden Cost of Numerical Instability
How much more are you paying for your financial risk analytics than you need to be?
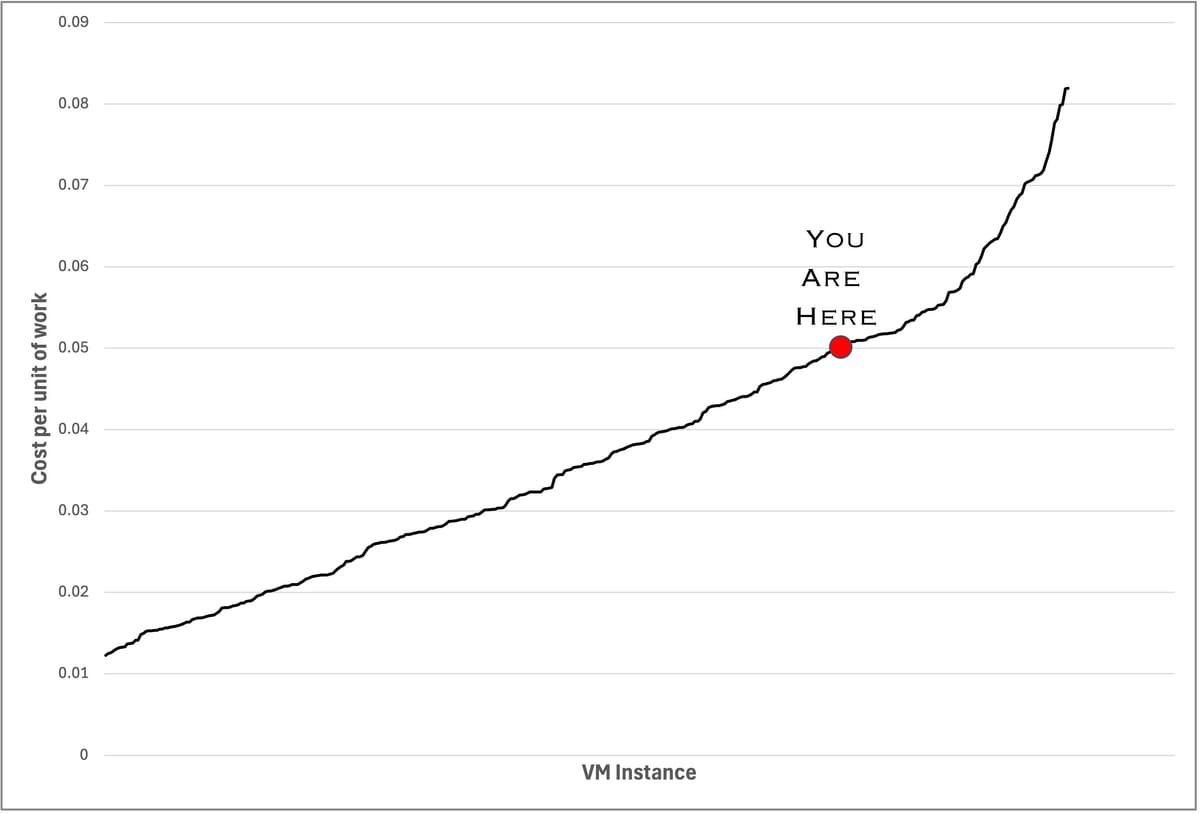
This graph shows the cost per unit of work done across the three largest cloud service providers and includes every VM type with the three most recent generations of CPU. Intel, AMD, Graviton, Axion and Cobalt. The work in this case is COREx, a benchmark designed from the outset to mimic a real financial risk system.
That red point is more than likely where you sit today.
Sure, it could be worse. But it could be so much cheaper too!
What’s stopping you from being further to bottom left of that chart? In some small part it is just infrastructure debt, but more than anything else it’s numerical instability and the technical debt created around a system that assumes a single CPU ISA.
Want to know more? I’ll be speaking about this (that chart is from slide 2 of my presentation) at Quant Minds on 18 November.
Apologies to those of you will be at SC25 instead. I don’t pick the dates 😦